Long description: Block221_Fig7
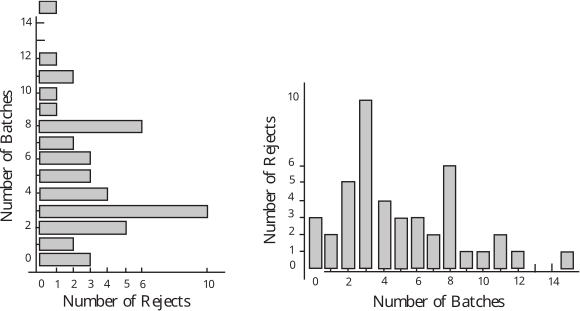
Alt text: The image displays two bar charts illustrating the distribution of counts for 'Number of Rejects' versus 'Number of Batches'.
This description was generated by AI and has not been verified by a human. If you spot an error, please use the feedback link below.
- The image contains two side-by-side bar charts. The chart on the left plots 'Number of Batches' on the y-axis against 'Number of Rejects' on the x-axis. This chart shows a count of 1 for 0 rejects, 1 for 1 reject, 2 for 2 rejects, 3 for 3 rejects, 5 for 4 rejects, 8 for 5 rejects, and 14 for 10 rejects.
- The chart on the right plots 'Number of Rejects' on the y-axis against 'Number of Batches' on the x-axis. This chart shows a count of 2 for 0 batches, 7 for 1 batch, 9 for 2 batches, 6 for 3 batches, 3 for 4 batches, 1 for 5 batches, 2 for 6 batches, 5 for 7 batches, 1 for 8 batches, 2 for 9 batches, 1 for 10 batches, 1 for 11 batches, and 1 for 14 batches.