Long description: Block221FigQ2bP
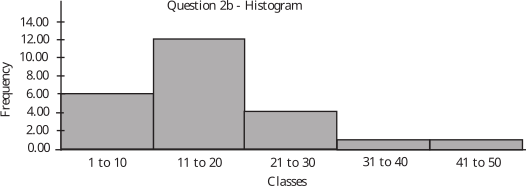
Alt text: A bar chart titled "Question 2b - Histogram" showing frequency across different classes.
This description was generated by AI and has not been verified by a human. If you spot an error, please use the feedback link below.
- The vertical axis is labeled "Frequency" and ranges from 0.00 to 14.00, marked in increments of 2.00.
- The horizontal axis is labeled "Classes" and has bins labeled "1 to 10", "11 to 20", "21 to 30", "31 to 40", and "41 to 50".
- For the class "1 to 10", the bar reaches a frequency of 6.00.
- For the class "11 to 20", the bar reaches a frequency of 12.00.
- For the class "21 to 30", the bar reaches a frequency of 4.00.
- For the class "31 to 40", the bar reaches a frequency slightly above 0.00, approximately 0.50.
- For the class "41 to 50", the bar reaches a frequency close to 0.00.