Long description: Block221_Fig13
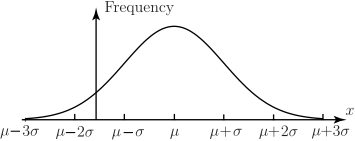
Alt text: A graph depicting a symmetric, bell-shaped curve, characteristic of a normal distribution, with the horizontal axis labeled with standard deviations from the mean.
This description was generated by AI and has not been verified by a human. If you spot an error, please use the feedback link below.
- The image is a graph showing the probability density function of a normal distribution.
- The vertical axis is labeled "Frequency," indicating the relative frequency or probability of a value.
- The horizontal axis is labeled with \(x\) and marked at intervals of one standard deviation (\(\text{standard deviation}\)) from the mean (\(\text{mean}\)), specifically at \(\text{mean} - 3\text{standard deviations}\), \(\text{mean} - 2\text{standard deviations}\), \(\text{mean} - \text{standard deviation}\), \(\text{mean}\), \(\text{mean} + \text{standard deviation}\), \(\text{mean} + 2\text{standard deviations}\), and \(\text{mean} + 3\text{standard deviations}\).
- The curve is bell-shaped, peaking directly above the center point labeled \(\text{mean}\).
- The curve is symmetrical, meaning the height of the curve decreases symmetrically as \(x\) moves away from the \(\text{mean}\) in either the positive or negative direction.