Long description: Block22_1_Fig12
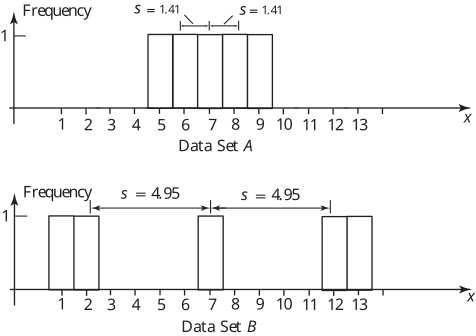
Alt text: Two bar charts labeled Data Set A and Data Set B show the frequency of data points across an x-axis ranging from one to thirteen.
This description was generated by AI and has not been verified by a human. If you spot an error, please use the feedback link below.
- The top chart, labeled Data Set A, displays bars at x-coordinates 5 through 9, with the frequency for each bar appearing to be one.
- The spacing indicated above the bars in Data Set A is labeled as \(s = 1.41\).
- The bottom chart, labeled Data Set B, displays three distinct sets of bars.
- The first set is at x-coordinates 1 through 3, with the frequency for each bar appearing to be one.
- The second set is at x-coordinates 6 through 8, with the frequency for each bar appearing to be one, and the spacing is indicated as \(s = 4.95\).
- The third set is at x-coordinates 11 through 13, with the frequency for each bar appearing to be one, and the spacing is indicated as \(s = 4.95\).