Long description: Block221_Fig16
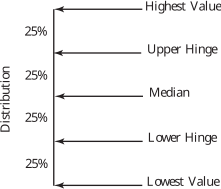
Alt text: A vertical diagram shows five horizontal lines labeled at quartiles: Highest Value, Upper-Hinge, Median, Lower-Hinge, and Lowest Value, each associated with a twenty-five percent marker on the vertical axis labeled 'Distribution'.
This description was generated by AI and has not been verified by a human. If you spot an error, please use the feedback link below.
- The diagram is oriented vertically, with the left side labeled "Distribution," and the right side showing markers representing specific quantiles.
- Five distinct horizontal lines are drawn across the figure, each indicating a boundary or value.
- The uppermost line is associated with "Highest Value."
- Below this is a line associated with "Upper-Hinge," which corresponds to a twenty-five percent mark on the distribution axis.
- The third line is marked "Median," also aligning with a twenty-five percent mark.
- The fourth line is marked "Lower-Hinge," aligning with a twenty-five percent mark.
- The lowest line shown is marked "Lowest Value," located at the bottom of the depicted range.