Long description: Block221FigQ7bP
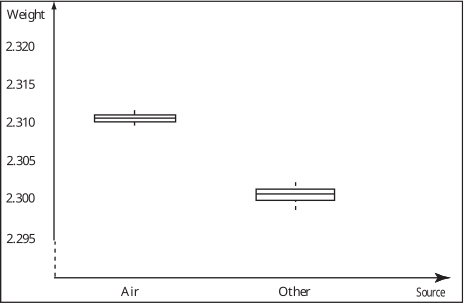
Alt text: A box plot compares the weight values for 'Air' and 'Other' sources.
This description was generated by AI and has not been verified by a human. If you spot an error, please use the feedback link below.
- The visualization is a box plot comparing 'Weight' on the vertical axis against two categories on the horizontal axis: 'Air' and 'Other'.
- For the 'Air' source, the box plot shows a central tendency around \(2.310\) weight units, with a small interquartile range.
- For the 'Other' source, the box plot shows a central tendency around \(2.300\) weight units, also with a narrow interquartile range.
- Visually, the median and the box boundaries for 'Air' are positioned higher than those for 'Other', indicating a consistently greater weight value for 'Air' compared to 'Other'.