Long description: Block222FigE7P
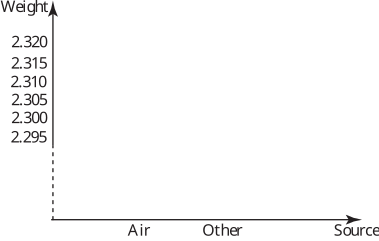
Alt text: A vertical bar graph shows the weight measurements for 'Air', 'Other', and 'Source', with all bars resting on the horizontal axis.
This description was generated by AI and has not been verified by a human. If you spot an error, please use the feedback link below.
- The image is a bar graph titled to represent 'Weight' on the vertical axis and three categories ('Air', 'Other', and 'Source') on the horizontal axis.
- The vertical axis is labeled 'Weight' and ranges from 2.295 to 2.320, with marked increments at intervals of 0.005.
- Three distinct vertical bars are present, corresponding to the categories 'Air', 'Other', and 'Source'.
- Each bar has a height of zero relative to the displayed scale, indicating a measured weight of zero for all three categories at the depicted level of precision. }