Long description: figure51aP
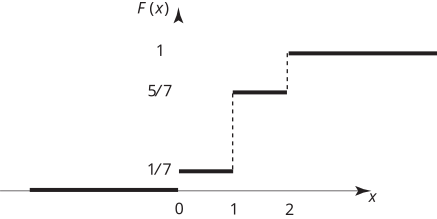
Alt text: The image displays a step function labeled \(F(x)\) plotted against the variable \(x\), showing discrete jumps in value.
This description was generated by AI and has not been verified by a human. If you spot an error, please use the feedback link below.
- The graph depicts a cumulative distribution function, \(F(x)\), plotted on a two-dimensional plane with \(x\) on the horizontal axis and \(F(x)\) on the vertical axis.
- For values of \(x\) from \(-\infty\) up to \(x=1\), the function \(F(x)\) is constant at a value of \(1/7\).
- At \(x=1\), the function value jumps up to \(5/7\).
- For values of \(x\) between \(x=1\) and \(x=2\), the function \(F(x)\) is constant at a value of \(5/7\).
- At \(x=2\), the function value jumps up to \(1\).
- For values of \(x\) greater than or equal to \(x=2\), the function \(F(x)\) remains constant at a value of \(1\).