Long description: figure51bP
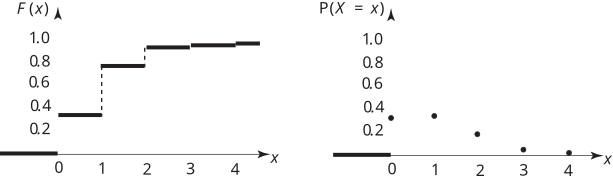
Alt text: The image displays two graphs related to a discrete probability distribution: a cumulative distribution function (CDF) and a probability mass function (PMF).
This description was generated by AI and has not been verified by a human. If you spot an error, please use the feedback link below.
- The graph on the left represents the cumulative distribution function, \(F(x)\), plotted against \(x\) on the horizontal axis, which ranges from zero to four.
- The values of \(F(x)\) on the vertical axis range from zero to one.
- The function \(F(x)\) starts at a value of 0.4 for \(x\) values less than one.
- At \(x=1\), the function jumps to a value of 0.8.
- For \(x\) values between one and two, the function remains at 0.8.
- At \(x=2\), the function jumps to a value of 1.0.
- For \(x\) values between two and four, the function remains at 1.0.
- The graph on the right represents the probability mass function, \(P(X=x)\), plotted against \(x\) on the horizontal axis, from zero to four.
- The values of \(P(X=x)\) on the vertical axis range from zero to one.
- There are visible points plotted at specific \(x\) values, indicating the probability for each integer \(x\) in the domain.
- At \(x=0\), a point is plotted at a height of 0.2.
- At \(x=1\), a point is plotted at a height of 0.4.
- At \(x=2\), a point is plotted at a height of 0.2.
- At \(x=3\), a point is plotted at a height of 0.2.
- At \(x=4\), a point is plotted at a height of 0.2.