Long description: figure6
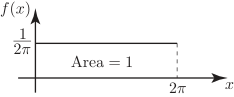
Alt text: The image displays a rectangular area under a curve, representing a probability density function, with an area labeled as equal to 1.
This description was generated by AI and has not been verified by a human. If you spot an error, please use the feedback link below.
- The graph shows a continuous function \(f(x)\) plotted on the vertical axis and \(x\) on the horizontal axis.
- The area under the curve is highlighted by a rectangle stretching from an unknown starting point to \(2\text{pi}\) on the horizontal axis.
- The height of the rectangle on the vertical axis is marked as \(\frac{1}{2\text{pi}}\) and this value is visible on the \(y\)-axis label.
- The area contained beneath this rectangular region is explicitly labeled as