Long description: figure7
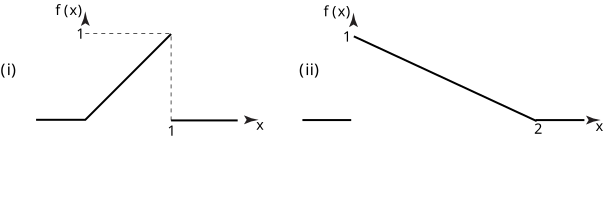
Alt text: The image displays two diagrams, (i) and (ii), representing probability density functions \(f(x)\) over a variable \(x\) on a horizontal axis.
This description was generated by AI and has not been verified by a human. If you spot an error, please use the feedback link below.
- Panel (i) shows a piecewise function \(f(x)\) defined on the interval from \(x=1\) to an unspecified point to the right.
- This function is constant at a low value for \(x\) values to the left of \(x=1\), then rises linearly to reach a peak at \(x=1\) before dropping to a value of zero immediately after \(x=1\), forming a triangle or a trapezoidal shape segment.
- Panel (ii) displays a straight, downward-sloping line segment representing a probability density function \(f(x)\) that starts at a maximum height at \(x=1\) and decreases linearly to a lower point at \(x=2\), suggesting a continuous, decreasing distribution over the interval from \(x=1\) to \(x=2\).