Long description: figure8
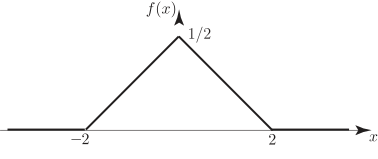
Alt text: A graph showing a triangular probability density function, f(x), that rises from zero at x equals negative two to a peak height of one-half at x equals zero, and then falls back to zero at x equals two.
This description was generated by AI and has not been verified by a human. If you spot an error, please use the feedback link below.
- The image displays a graph representing a continuous probability density function, denoted as \(f(x)\).
- The horizontal axis is labeled with \(x\), ranging at least from negative two to two.
- The vertical axis represents the function value, \(f(x)\).
- The function forms a solid triangle shape on the graph.
- The function value is zero at \(x\) equals negative two and at \(x\) equals two.
- The peak of the triangular function occurs directly above \(x\) equals zero, where the function value reaches one-half.
- The sides connecting the points (negative two, 0), (zero, one-half), and (two, 0) are straight lines, indicating the linear nature of the density function between these points.