Long description: CumulativeDistFct
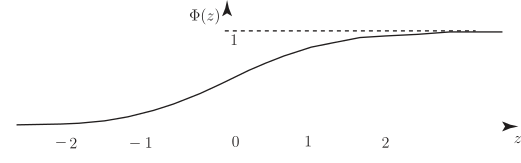
Alt text: The graph displays the cumulative distribution function, \(\Phi(z)\), for a standard normal distribution.
This description was generated by AI and has not been verified by a human. If you spot an error, please use the feedback link below.
- The horizontal axis is labeled with values ranging from \(-2\) to at least \(3\), representing the variable \(z\).
- The vertical axis represents the cumulative probability, \(\Phi(z)\).
- The plotted curve is a smooth, monotonically increasing sigmoid shape, characteristic of a cumulative distribution function.
- The function starts near \(0\) for values of \(z\) far to the left (e.g., at \(z=-2\)).
- The curve rises steeply around \(z=0\), where \(\Phi(0) = 0.5\).
- As \(z\) increases further to the right, the curve flattens out, approaching a limit of \(1\).
- A dashed horizontal line is drawn at a probability value of \(1\), indicating the upper bound of the cumulative distribution.