Long description: fig7
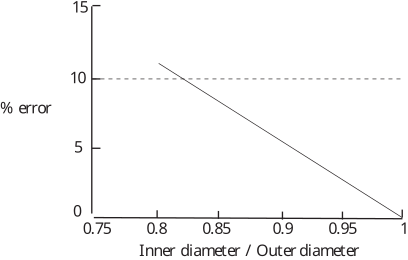
Alt text: A line graph showing the percentage error decreasing linearly as the ratio of the inner diameter to the outer diameter increases from 0.75 to 1.
This description was generated by AI and has not been verified by a human. If you spot an error, please use the feedback link below.
- The graph plots percentage error on the vertical axis, ranging from 0 to 15%, and the ratio of the inner diameter to the outer diameter on the horizontal axis, ranging from 0.75 to 1.
- A horizontal dashed line is visible at a percentage error of 10%.
- A solid line graph starts at the point (0.75, approximately 11%) and slopes downward to the point (1, 0%).
- The relationship shown is a negative linear correlation, indicating that as the inner diameter to outer diameter ratio approaches 1, the percentage error decreases toward 0%.