Long description: block5fig5
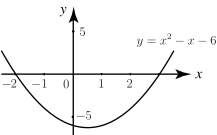
Alt text: The graph displays a parabola representing the equation \(y=x^2-x-6\) on a coordinate plane.
This description was generated by AI and has not been verified by a human. If you spot an error, please use the feedback link below.
- The image shows a standard two-dimensional Cartesian coordinate system with an x-axis and a y-axis labeled with numerical markings.
- A parabolic curve is drawn on the coordinate plane, representing the function \(y=x^2-x-6\).
- The vertex of the parabola is visible and appears to be located at the point \((0.5, -6.25)\) (this is an estimation based on the visible scale, as the true vertex is at \(x=0.5\)).
- The parabola opens upwards.
- The graph intersects the x-axis at two points: one at \(x=-2\) and another at \(x=3\) (though the x-intercept at \(x=3\) is slightly off the visible right edge of the drawn curve segment).
- The y-intercept, where the curve crosses the y-axis, is at the point \((0, -6)\).
- The axes are marked with tick marks and labeled with values such as \(-2, -1, 0, 1, 2\) on the x-axis and values up to \(5\) on the y-axis.