Long description: block5fig6z
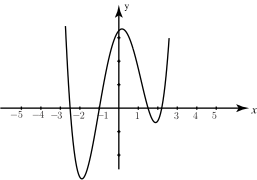
Alt text: The graph shows a sinusoidal wave function plotted on a coordinate plane, intersecting the x-axis at several points.
This description was generated by AI and has not been verified by a human. If you spot an error, please use the feedback link below.
- The image displays a graph of a function plotted on a Cartesian coordinate system, with the horizontal axis labeled "x" and the vertical axis labeled "y".
- The curve is continuous and exhibits wave-like oscillations, characteristic of a trigonometric function.
- The graph passes through the origin, or very close to it, but it generally shows multiple peaks and troughs.
- Several labeled points on the x-axis range from minus five to five, marked in integer increments.
- The curve appears to cross the x-axis approximately at x = -3, x = -1, x = 1, and x = 3.
- The overall shape suggests the function is being analyzed in the context of solving an inequality, as noted by the provided context regarding solving inequalities.