Long description: figure1
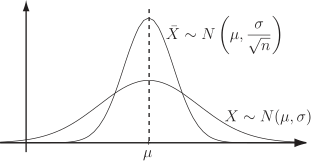
Alt text: A graph shows two normal distribution curves, one centered at \(\text{X} \text{ ~} \text{N}(\text{μ}, \text{σ}^2)\) and the other centered at \(\bar{\text{X}} \text{ ~} \text{N}(\text{μ}, \frac{\text{σ}^2}{n})\).
This description was generated by AI and has not been verified by a human. If you spot an error, please use the feedback link below.
- The graph displays two distinct probability density functions plotted against a horizontal axis labeled \(\text{μ}\).
- The curve on the right is labeled \(\text{X} \text{ ~} \text{N}(\text{μ}, \text{σ}^2)\), representing a normal distribution with a mean of \(\text{μ}\) and a variance of \(\text{σ}^2\).
- The curve on the left is labeled \(\bar{\text{X}} \text{ ~} \text{N}(\text{μ}, \frac{\text{σ}^2}{n})\), representing a normal distribution with the same mean \(\text{μ}\) but a smaller variance of \(\frac{\text{σ}^2}{n}\), where \(n\) is the sample size.
- A vertical dashed line is drawn passing through the mean \(\text{μ}\), indicating the center for both distributions.