Long description: figure2
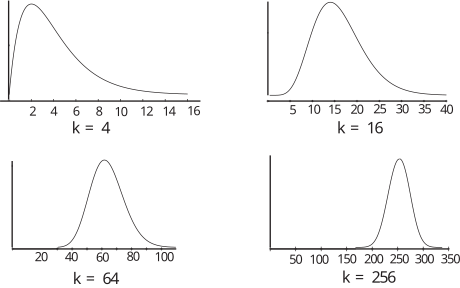
Alt text: Four plots display curves that peak and decline as the value of \(k\) increases: \(k=4\), \(k=16\), \(k=64\), and \(k=256\).
This description was generated by AI and has not been verified by a human. If you spot an error, please use the feedback link below.
- The top-left plot, labeled for \(k=4\), shows a curve that rises to a peak before gradually decreasing as the horizontal axis value increases from \(2\) to \(16\).
- The top-right plot, labeled for \(k=16\), displays a curve that peaks and then declines as the horizontal axis value increases from \(5\) to \(40\).
- The bottom-left plot, labeled for \(k=64\), presents a curve that rises to a peak and then falls as the horizontal axis value increases from \(20\) to \(100\).
- The bottom-right plot, labeled for \(k=256\), illustrates a curve that peaks and then drops as the horizontal axis value increases from \(50\) to \(350\).