Long description: figure3
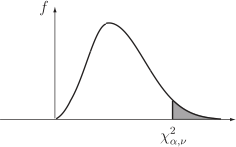
Alt text: The image displays the probability density function of a chi-squared distribution with a specified number of degrees of freedom, with a shaded area representing a probability from the left tail up to a certain value.
This description was generated by AI and has not been verified by a human. If you spot an error, please use the feedback link below.
- The graph shows a curve representing a probability density function, labeled \(f\), on the vertical axis and \(\text{chi-squared}\) (\(\text{X}^2_{\text{alpha}, \text{nu}}\)) on the horizontal axis.
- The curve is bell-shaped and starts at zero, increases to a peak, and then decreases, characteristic of a chi-squared distribution.
- A shaded region is present under the curve, starting from the far left (the lower tail) and extending up to a specific point on the horizontal axis.
- The vertical line segment defining the right boundary of the shaded area is implied by the shaded region itself.