Long description: figure4
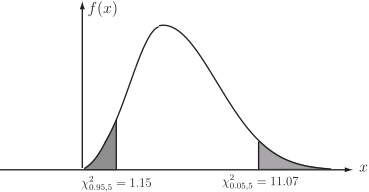
Alt text: A curve representing the probability density function of a chi-squared distribution, with two shaded areas indicating probabilities between marked values on the x-axis.
This description was generated by AI and has not been verified by a human. If you spot an error, please use the feedback link below.
- The image displays a graph with the function \(f(x)\) on the vertical axis and \(x\) on the horizontal axis, characteristic of a probability density function curve.
- The curve is bell-shaped and rises to a peak before descending towards the right, representing the chi-squared distribution.
- Two vertical shaded regions are marked beneath the curve, corresponding to two specific intervals on the horizontal axis.
- The left shaded region spans from the far left edge (or a specific implied lower bound) up to the value \(\chi^2_{0.95, 5} = 1.15\).
- The right shaded region spans from the value \(\chi^2_{0.05, 5} = 11.07\) towards the right edge of the displayed probability curve.
- The graph illustrates the area under the curve corresponding to probabilities within certain defined ranges determined by the values \(1.15\) and \(11.07\) on the \(x\)-axis.