Long description: figure5
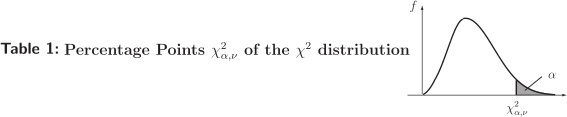
Alt text: A graph illustrating the chi-squared distribution with an area labeled \( \alpha \) in the right tail.
This description was generated by AI and has not been verified by a human. If you spot an error, please use the feedback link below.
- The image displays a probability density function plot for the chi-squared distribution, denoted by \( \chi^2 \) with a degrees of freedom parameter \( v \).
- The horizontal axis represents the value of the chi-squared variable, \( \chi^2_{\alpha, v} \).
- The vertical axis is labeled \( f \), representing the probability density function's height.
- The curve shows a bell-like shape characteristic of the distribution, starting near zero, peaking, and then decreasing.
- A specific area, shaded beneath the curve and labeled with the Greek letter \( \alpha \), is marked in the right tail of the distribution, indicating a probability level.