Long description: workbook23Fig123
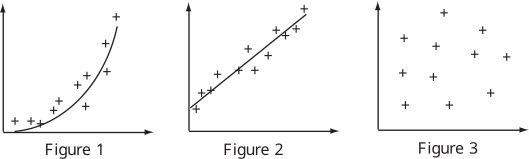
Alt text: Three scatter plots are displayed, showing an upward curve, a positive linear trend, and a random distribution of points.
This description was generated by AI and has not been verified by a human. If you spot an error, please use the feedback link below.
- Figure 1 shows a scatter plot of data points that generally follow an upward-curving pattern, suggesting a curvilinear relationship.
- Figure 2 displays a scatter plot where the data points cluster around a straight line sloping upwards from the lower left to the upper right, indicating a positive linear correlation.
- Figure 3 presents a scatter plot with several data points scattered across the viewing area without any discernible pattern or trend.