Long description: workbook23Fig5
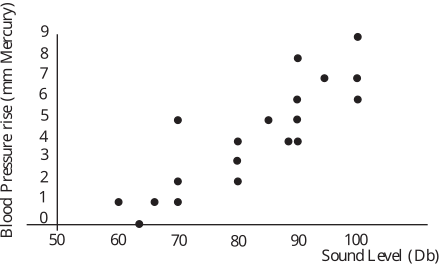
Alt text: A scatter plot showing that the blood pressure rise in millimeters of mercury generally increases as the sound level in decibels increases.
This description was generated by AI and has not been verified by a human. If you spot an error, please use the feedback link below.
- The horizontal axis represents the Sound Level in decibels, ranging from \(50\) to \(110\) with labeled increments.
- The vertical axis represents the Blood Pressure rise in millimeters of mercury, ranging from \(0\) to \(9\) with labeled increments.
- The data points generally show an increasing trend, with the blood pressure rise increasing as the sound level increases.
- At a sound level of \(60\) decibels, the blood pressure rise is very low, around \(0.2\) millimeters of mercury.
- At a sound level of \(70\) decibels, the blood pressure rise is around \(1.3\) millimeters of mercury.
- At a sound level of \(80\) decibels, the blood pressure rise is approximately \(4.7\) millimeters of mercury.
- At a sound level of \(90\) decibels, the blood pressure rise is around \(4.2\) millimeters of mercury, with other points at approximately \(3.5\) and \(5.1\) millimeters of mercury.
- At a sound level of \(100\) decibels, the blood pressure rise is approximately \(5.8\) millimeters of mercury.
- The data suggests a positive correlation between sound level and blood pressure rise.