Long description: workbook23Fig6
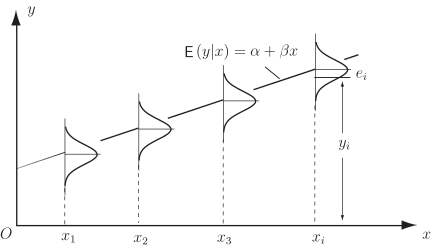
Alt text: A graph illustrating the conditional expectation, \(E(y|x) = \alpha + \beta x\), plotted over several points along the horizontal axis labeled \(x\).
This description was generated by AI and has not been verified by a human. If you spot an error, please use the feedback link below.
- The graph displays a series of curves plotted on a two-dimensional coordinate system with the vertical axis labeled \(y\) and the horizontal axis labeled \(x\).
- Several vertical dashed lines mark specific points along the \(x\)-axis, labeled \(x_1\), \(x_2\), \(x_3\), and \(x_i\).
- Above the curves, the mathematical expression \(E(y|x) = \alpha + \beta x\) is displayed.
- At the rightmost point, \(x_i\), a vertical double-headed arrow labeled \(e_i\) indicates a change in the \(y\)-value.
- A vertical double-headed arrow labeled \(y_i\) indicates a corresponding change in the \(y\)-value at point \(x_i\) relative to the baseline or the value at \(x=0\) (though the specific starting value is not labeled for \(y_i\)).
- The curves generally follow an increasing, somewhat concave-downward trend as \(x\) increases, representing the function \(E(y|x)\). The structure suggests a relationship between the expected value of a variable \(y\) given a value of \(x\) and the value of \(x\) itself.