Long description: TableCase1
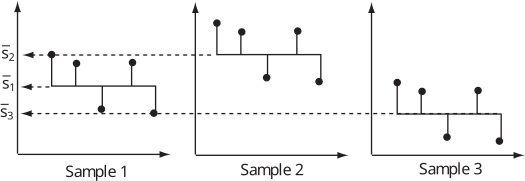
Alt text: Three box diagrams labeled Sample 1, Sample 2, and Sample 3 illustrate data sets with corresponding error bars.
This description was generated by AI and has not been verified by a human. If you spot an error, please use the feedback link below.
- The image displays three separate diagrams arranged horizontally, labeled Sample 1, Sample 2, and Sample 3, each representing a sample data set.
- Each sample set is represented by a vertical axis with tick marks labeled \(\bar{S}_2\), \(\bar{S}_1\), and \(\bar{S}_3\) from top to bottom.
- Sample 1 shows three solid black circles connected by vertical lines, suggesting three data points are centered at levels \(\bar{S}_2\), \(\bar{S}_1\), and \(\bar{S}_3\), with the error bars indicating the range around these means.
- Sample 2 shows four solid black circles connected by vertical lines, suggesting four data points are centered at the same three levels, \(\bar{S}_2\), \(\bar{S}_1\), and \(\bar{S}_3\).
- Sample 3 displays three solid black circles connected by vertical lines, with the error bars suggesting three data points are centered at the same three levels, \(\bar{S}_2\), \(\bar{S}_1\), and \(\bar{S}_3\).