Long description: TableCase2
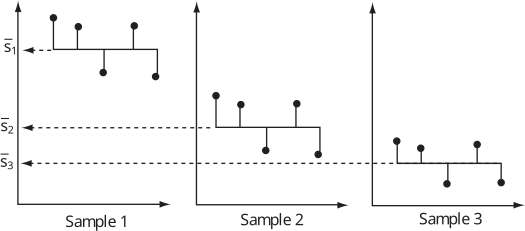
Alt text: Three separate plots labeled Sample 1, Sample 2, and Sample 3, each showing a set of points connected by a line to illustrate data.
This description was generated by AI and has not been verified by a human. If you spot an error, please use the feedback link below.
- The image contains three vertical plots, arranged from left to right and labeled Sample 1, Sample 2, and Sample 3, respectively.
- Each plot displays multiple black circular data points connected by horizontal lines, suggesting a measured range or spread of data for that sample.
- In Sample 1, there are four data points connected by lines, positioned vertically below a dashed horizontal line labeled \(\text{S}_1\).
- In Sample 2, there are four data points connected by lines, positioned vertically below a dashed horizontal line labeled \(\text{S}_2\).
- In Sample 3, there are four data points connected by lines, positioned vertically below a dashed horizontal line labeled \(\text{S}_3\). The vertical positioning of the points and the associated dashed lines appear to change across the samples.