Long description: table4
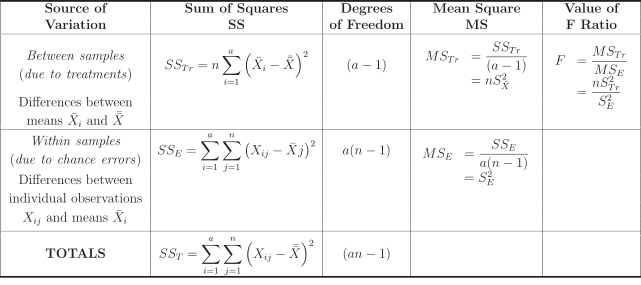
Alt text: A table summarizing the formulas for sources of variation in an analysis of variance.
This description was generated by AI and has not been verified by a human. If you spot an error, please use the feedback link below.
- The table has five columns: "Source of Variation," "Sum of Squares (SS)", "Degrees of Freedom," "Mean Square (MS)", and "Value of F-Ratio."
- The first row details "Between samples (due to treatments)": The Sum of Squares is shown as \(\sum_{i=1}^{a} n(\bar{X}_{i} - \bar{X})^2\), the Degrees of Freedom is \((a - 1)\), the Mean Square is \(\frac{SS_{Tr}}{nS_{E}}\), and the F-Ratio is \(\frac{MS_{Tr}}{MS_{E}}\).
- The second row details "Within samples (due to chance-errors)": The Sum of Squares is shown as \(\sum_{i=1}^{a}\sum_{j=1}^{n}(X_{ij} - \bar{X}_{i})^2\), the Degrees of Freedom is \(a(n - 1)\), the Mean Square is \(\frac{SS_{E}}{a(n - 1)}\), and the F-Ratio is \(\frac{SS_{Tr}}{SS_{E}}\).
- The final row labeled "TOTALS" shows the overall sum of squares as \(\sum_{i=1}^{a}\sum_{j=1}^{n}(X_{ij} - \bar{X})^2\), the Degrees of Freedom is \((an - 1)\), and the columns for Mean Square and F-Ratio are left blank.