Long description: table10
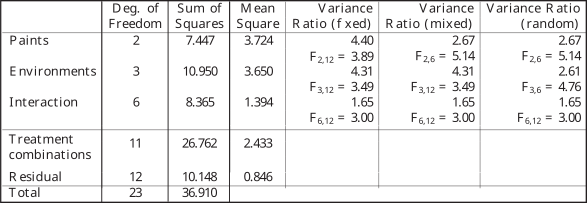
Alt text: A table detailing the results of a two-way Analysis of Variance (ANOVA), showing sums of squares and mean ratios for different factors.
This description was generated by AI and has not been verified by a human. If you spot an error, please use the feedback link below.
- The table presents results from a two-way Analysis of Variance (ANOVA) for two factors: 'Paints' and 'Environments'.
- The columns display the 'Deg. of Freedom', 'Sum of Squares', 'Mean Square', 'Variance Ratio (\(f\times d\))', 'Variance Ratio (f x ed)', and 'Variance Ratio (random)' for these calculated values.
- The row for 'Paints' has a 'Deg. of Freedom' of 2, a 'Sum of Squares' of 7.447, and a 'Mean Square' of 3.724.
- The row for 'Environments' has a 'Deg. of Freedom' of 3, a 'Sum of Squares' of 10.950, and a 'Mean Square' of 3.650.
- The interaction row has a 'Deg. of Freedom' of 6, a 'Sum of Squares' of 8.365, and a 'Mean Square' of 1.394.
- The row labeled 'Treatment combinations' shows a 'Deg. of Freedom' of 11, a 'Sum of Squares' of 26.762, and a 'Mean Square' of 2.433.
- The 'Residual' row has a 'Deg. of Freedom' of 12 and a 'Sum of Squares' of 10.148.
- The 'Total' row summarizes the results with a 'Deg. of Freedom' of 23, a 'Sum of Squares' of 36.910, and a 'Mean Square' of 0.846.