Long description: figure7
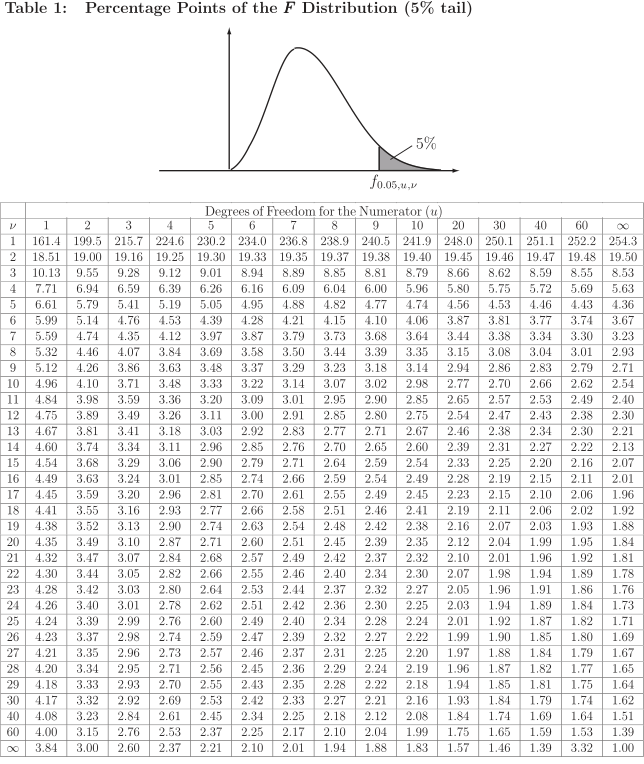
Alt text: A line graph titled "Table 1: Percentage-Points of the F-Distribution (5% tail)" shows the relationship between degrees of freedom for the numerator and denominator.
This description was generated by AI and has not been verified by a human. If you spot an error, please use the feedback link below.
- The graph is titled "Table 1: Percentage-Points of the F-Distribution (5% tail)" and uses the variable "\(F_{0.05, u}\)" on the horizontal axis.
- The horizontal axis represents the degrees of freedom for the numerator, labeled from 1 to 60, with marks at intervals of 10.
- The vertical axis represents the corresponding F-distribution value, although specific labels are not provided, the title indicates it shows percentage points for the 5% tail.
- The plot features a distinct curve, connecting various data points representing the calculated F-distribution value for different values of the numerator degrees of freedom, holding the denominator degrees of freedom constant or varying systematically across the displayed table structure.