Long description: bathtub
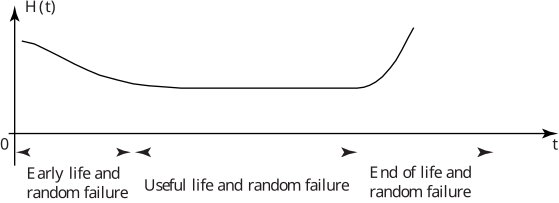
Alt text: A graph showing the bathtub curve for reliability, which decreases, remains relatively constant, and then increases.
This description was generated by AI and has not been verified by a human. If you spot an error, please use the feedback link below.
- The horizontal axis represents time, labeled as \(t\), and the vertical axis represents the reliability function, labeled as \(H(t)\).
- The curve starts at a high value on the left side, corresponding to the "Early and random failure" period.
- The curve then decreases to a minimum level, illustrating the initial high rate of failures.
- Following the initial decrease, the curve remains relatively flat and stable over a period labeled "Useful life and random failure", indicating a period of stable reliability.
- Towards the right side of the graph, the curve begins to increase, corresponding to the "End of life and random failure" period, suggesting a decline in reliability in this stage.