Long description: weibulFig
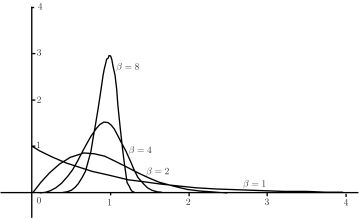
Alt text: A graph illustrating the Weibull distribution curves for different values of the shape parameter, beta, specifically beta equals one, two, four, and eight.
This description was generated by AI and has not been verified by a human. If you spot an error, please use the feedback link below.
- The image displays a graph with the Weibull distribution plotted against a horizontal axis ranging from zero to four, and a vertical axis ranging from zero to four.
- Four distinct curves are shown, each corresponding to a different value of the shape parameter, beta: \(\beta = 1\), \(\beta = 2\), \(\beta = 4\), and \(\beta = 8\).
- The curve for \(\beta = 8\) is the tallest and narrowest, peaking at a value near three. It is positioned the furthest to the right compared to the other curves.
- The curve for \(\beta = 4\) is visibly less peaked and has shifted to the right compared to the \(\beta = 8\) curve.
- The curve for \(\beta = 2\) is broader and its peak is lower than that of the \(\beta = 4\) curve.
- The curve for \(\beta = 1\) is the lowest and flattest of the four, trailing off gradually across the visible range of the horizontal axis.