Long description: QCFigTable
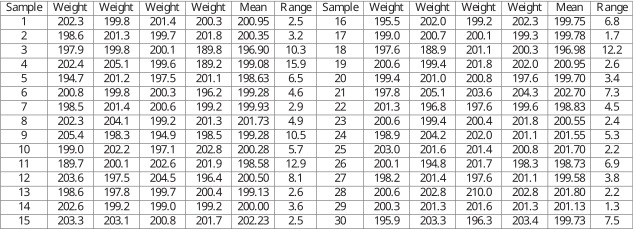
Alt text: A table displaying quality control data with measurements for samples 1 through 30 across various weight metrics and ranges.
This description was generated by AI and has not been verified by a human. If you spot an error, please use the feedback link below.
- The table is titled with columns for 'Sample', 'Weight', 'Weight', 'Weight', 'Weight', 'Mean', and 'Range'.
- There are 30 rows, corresponding to samples labeled 1 through 30.
- For each sample, several weight measurements are provided, labeled generally as 'Weight' columns, followed by a 'Mean' and a 'Range' for summary statistics.
- The data appears to show trends in measured weights and calculated means across the samples.
- For example, in Sample 1, the reported measurements include 192.3, 199.8, 201.4, 200.3 for the weight values, a mean of 200.95, and a range of 3.2.
- The final sample, Sample 30, shows weight values of 195.9, 203.3, 196.3, and 199.7, with a mean of 201.3 and a range of 7.5.