Long description: paretochart
Alt text: A Pareto chart titled "Pareto Chart of Cause" illustrating defect counts for different causes.
This description was generated by AI and has not been verified by a human. If you spot an error, please use the feedback link below.
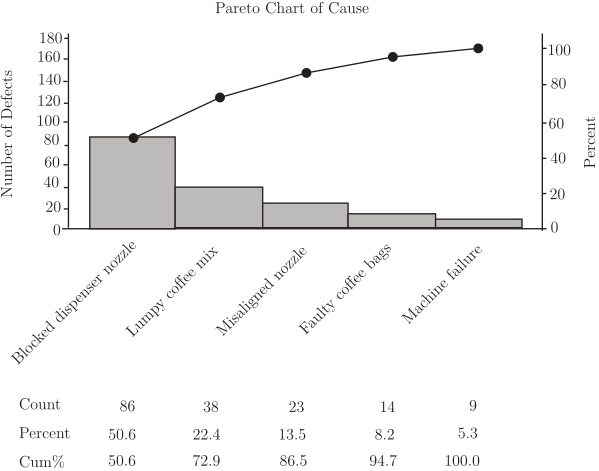
- The chart displays the "Pareto Chart of Cause" with defect counts plotted against five categories: "Blocked dispenser nozzle," "Lumpy coffee mix," "Misaligned nozzle," "Faulty coffee bags," and "Machine failure."
- The vertical axis on the left represents the "Number of Defects," ranging from zero to 180.
- The chart shows that "Blocked dispenser nozzle" is the most frequent cause, with a count of 86 defects, which accounts for 50.6 percent of the total.
- "Lumpy coffee mix" is the second most common cause, with a count of 38 defects, representing 22.4 percent.
- "Misaligned nozzle" follows with a count of 23 defects, making up 13.5 percent of the defects.
- "Faulty coffee bags" has a count of 14 defects, accounting for 8.2 percent.
- "Machine failure" is the least frequent cause, with a count of 9 defects, contributing 5.3 percent.
- The cumulative percentage line shows that the first two categories, "Blocked dispenser nozzle" and "Lumpy coffee mix," together account for 72.9 percent of the total defects.