Long description: qcfig1
Alt text: A flow chart illustrating the process of correcting assignable variation, starting from a production line and involving statistical quality control.
This description was generated by AI and has not been verified by a human. If you spot an error, please use the feedback link below.
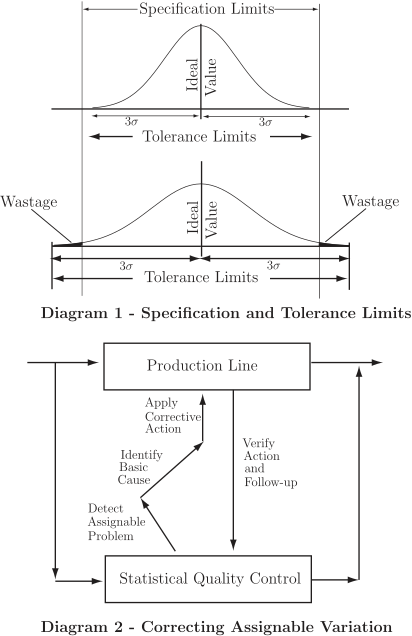
- The diagram, titled "Diagram 2 - Correcting Assignable Variation," shows a cyclical process involving the "Production Line" and "Statistical Quality Control."
- The process begins with the "Production Line," which can lead to detecting an assignable problem.
- From the "Production Line," the process flows to "Statistical Quality Control" through an arrow labeled "Detect Assignable Problem."
- The "Statistical Quality Control" block connects back to the "Production Line" through an arrow labeled "Apply Corrective Action."
- An arrow also points from the "Production Line" to "Statistical Quality Control" labeled "Verify Action and Follow-up."
- The diagram visually implies that when an assignable problem is detected, corrective actions are applied, verified, and followed up using statistical quality control methods.