Long description: qcfig4
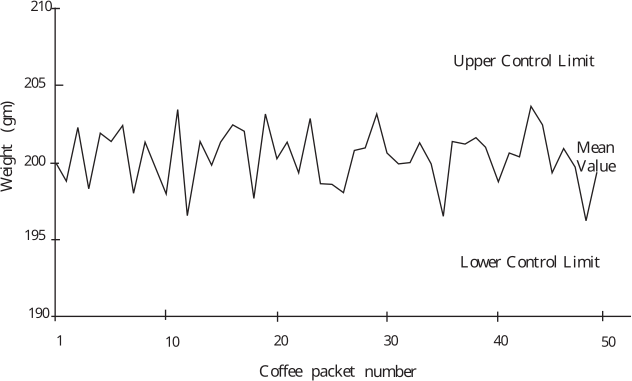
Alt text: A control chart illustrating the weight of coffee packets over fifty units, showing values fluctuating around a mean with upper and lower control limits.
This description was generated by AI and has not been verified by a human. If you spot an error, please use the feedback link below.
- The chart displays weight in grams on the vertical axis, ranging from \(190\) to \(210\) grams, and the coffee packet number on the horizontal axis, ranging from \(1\) to \(50\).
- The plotted data points represent the measured weight for each coffee packet, showing considerable fluctuation over the fifty packets.
- The graph includes horizontal lines indicating the Upper Control Limit, the Lower Control Limit, and the Mean Value, which appear to center the process variation.
- The weights generally fluctuate between approximately \(195\) grams and \(208\) grams, with several points near the upper and lower control boundaries.