Long description: qcfig5
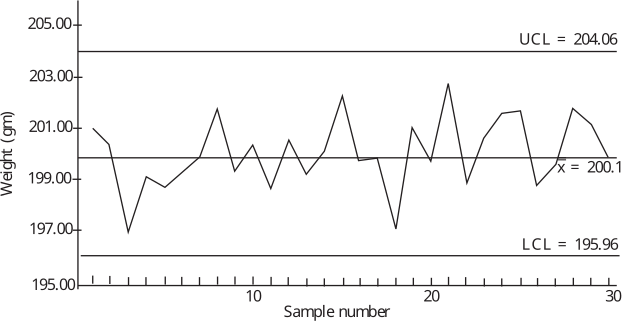
Alt text: A line graph shows the weight in grams versus the sample number for thirty samples, with upper and lower control limits marked.
This description was generated by AI and has not been verified by a human. If you spot an error, please use the feedback link below.
- The vertical axis, labeled "Weight (gm)", ranges from one hundred ninety-five point zero to two oh five point zero grams.
- The horizontal axis represents the "Sample number", with increments marked from zero to thirty.
- Three horizontal lines indicating control limits are visible: the Upper Control Limit (UCL) is at two hundred four point zero six grams, the Center Line (CL) is at two hundred grams, and the Lower Control Limit (LCL) is at one hundred ninety-five point nine six grams.
- The plotted data points fluctuate over the thirty samples, generally staying between one hundred ninety-seven grams and two oh three grams.
- The weight for the first sample is slightly below two hundred grams, around one hundred ninety-nine point five grams.
- The weight fluctuates throughout the samples, reaching a high point near two oh three grams around sample number nineteen and a low point near one hundred ninety-seven point zero grams around sample number twenty-two.
- The weight for the last sample, sample number thirty, is around two hundred one point zero grams.