Long description: qcfig9
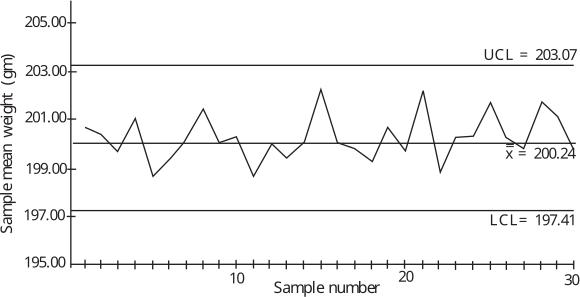
Alt text: A line graph titled Sample mean weight versus Sample number, showing fluctuations in weight measurements across samples 1 to 30.
This description was generated by AI and has not been verified by a human. If you spot an error, please use the feedback link below.
- The graph plots the sample mean weight in grams on the vertical axis, ranging from 195.00 to 205.00, against the sample number on the horizontal axis, which runs from 1 to 30.
- The data points are connected by a line, illustrating the sample mean weight for each sample.
- Upper and lower control limits are drawn on the graph: the upper control limit (UCL) is set at 203.07 grams, and the lower control limit (LCL) is set at 197.41 grams.
- A center line, representing the overall mean (\(\bar{x}\)), is drawn at 199.24 grams.
- The sample mean weight fluctuates over the 30 samples, generally staying between 198.00 grams and 201.50 grams, occasionally approaching the control limits.