Long description: TrigFig17
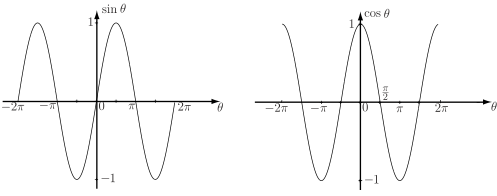
Alt text: The image displays two graphs: the sine function, \(\sin \theta\), and the cosine function, \(\cos \theta\), both plotted on the same coordinate system against the angle \(\theta\).
This description was generated by AI and has not been verified by a human. If you spot an error, please use the feedback link below.
- The image contains two distinct graphs plotted on a coordinate system where the horizontal axis represents the angle \(\theta\) and the vertical axis represents the function's value.
- The graph on the left plots the sine function, \(\sin \theta\), which shows a standard sinusoidal wave pattern with a maximum value of one and a minimum value of negative one.
- The graph on the right plots the cosine function, \(\cos \theta\), which also shows a standard sinusoidal wave pattern with a maximum value of one and a minimum value of negative one.
- Both functions are shown over the interval from \(-2\pi\) to \(2\pi\) on the horizontal axis.
- The sine function graph passes through the point \((0, 0)\) and reaches its maximum value at \(\frac{\pi}{2}\) and its minimum value at \(\frac{3\pi}{2}\).
- The cosine function graph also passes through the point \((0, 1)\) and reaches its minimum value at \(\pi\) and its maximum value at \(2\pi\) (within the displayed range).