Long description: TrigFig18
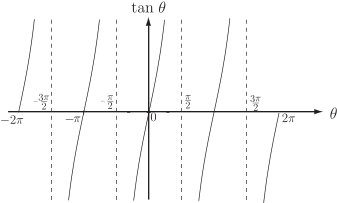
Alt text: The graph of the tangent function, \(\tan \theta\), plotted on a coordinate system with the horizontal axis representing \(\theta\) and the vertical axis representing \(\tan \theta\).
This description was generated by AI and has not been verified by a human. If you spot an error, please use the feedback link below.
- The graph shows a repeating, periodic curve representing the tangent function, \(\tan \theta\).
- The horizontal axis is labeled with the angle \(\theta\), marked at intervals including \(-\pi\), \(-\frac{3}{2}\pi\), \(0\), \(\frac{\pi}{2}\), \(\frac{3}{2}\pi\), and \(2\pi\).
- The vertical axis is labeled \(\tan \theta\).
- Several vertical dashed lines are drawn at values such as \(-\frac{3}{2}\pi\), \(-\pi\), \(-\frac{\pi}{2}\), \(\frac{\pi}{2}\), \(\frac{3}{2}\pi\), and \(2\pi\), indicating the vertical asymptotes where the function is undefined.
- The curve approaches the vertical asymptote at \(-\frac{\pi}{2}\) from the left and from the right.
- Similarly, the curve approaches vertical asymptotes at \(\frac{\pi}{2}\) and \(\frac{3}{2}\pi\).
- The function passes through the origin, \((0, 0)\), and exhibits a periodic wave shape characteristic of the tangent function.