Long description: ex2fig3
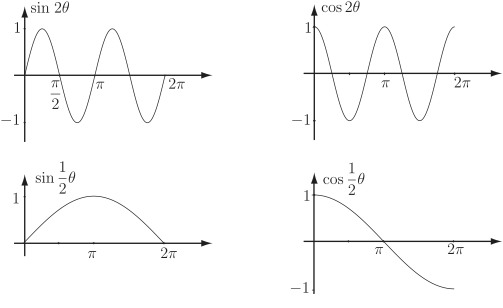
Alt text: The image shows four graphs illustrating trigonometric functions: sine and cosine waves for \(2\theta\), and \(\sin(1/2\theta)\) and \(\cos(1/2\theta)\) over the interval from \(0\) to \(2\pi\).
This description was generated by AI and has not been verified by a human. If you spot an error, please use the feedback link below.
- The top-left graph plots the function \(\sin(2\theta)\) against \(\theta\), showing a standard sinusoidal wave oscillating between a maximum value of \(1\) and a minimum value of \(-1\) over the interval from \(0\) to \(2\pi\). The wave completes two full cycles in this interval.
- The top-right graph plots the function \(\cos(2\theta)\) against \(\theta\), also showing a standard sinusoidal wave oscillating between a maximum value of \(1\) and a minimum value of \(-1\) over the interval from \(0\) to \(2\pi\). The wave completes two full cycles in this interval.
- The bottom-left graph plots the function \(\sin(1/2\theta)\) against \(\theta\), depicting a smooth, non-repeating curve that starts at \(0\) when \(\theta\) is \(0\), reaches a maximum value of \(1\) around \(\theta = \pi\), and approaches a value slightly less than \(-1\) as \(\theta\) approaches \(2\pi\) (though the visible scale limits the full range).
- The bottom-right graph plots the function \(\cos(1/2\theta)\) against \(\theta\), illustrating a smooth, non-repeating curve that starts at \(1\) when \(\theta\) is \(0\), decreases to a minimum value of \(-1\) around \(\theta = 2\pi\), and remains entirely above the line \(\cos(1/2\theta) = -1\) within the plotted viewing area.