Long description: projectile
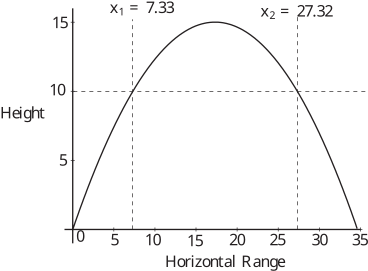
Alt text: A graph showing a parabolic curve representing projectile motion, with vertical dashed lines marking coordinates \(x_1 = 7.33\) and \(x_2 = 27.32\).
This description was generated by AI and has not been verified by a human. If you spot an error, please use the feedback link below.
- The image displays a graph with 'Height' on the vertical axis and 'Horizontal Range' on the horizontal axis.
- A smooth, parabolic curve is drawn, resembling the trajectory of a projectile.
- The curve starts at the origin (0, 0) and rises to a peak height near the horizontal position of 18.
- The graph includes two dashed vertical lines: one at the horizontal position \(x_1 = 7.33\) and another at \(x_2 = 27.32\).
- A dashed horizontal line is drawn across the graph, intersecting the parabolic curve at the marked coordinates, indicating a specific height value (approximately 10 on the vertical axis).