Long description: workbook6block2fig1
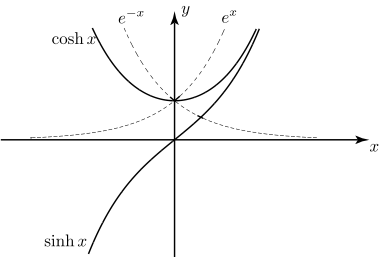
Alt text: The image displays the graphs of the hyperbolic sine function, \text{sinh}(x), and the hyperbolic cosine function, \text{cosh}(x), plotted on a Cartesian coordinate system.
This description was generated by AI and has not been verified by a human. If you spot an error, please use the feedback link below.
- The graph shows two curves plotted on an x-y coordinate system.
- One curve, labeled \text{sinh}(x), is a steep, upward-opening curve that passes through the origin and increases as \(x\) increases in both the positive and negative directions.
- The second curve, labeled \text{cosh}(x), is a U-shaped curve that opens upward, with its vertex located at the origin (0, 1). It decreases as \(x\) moves away from the origin in either direction before increasing again.
- Dashed lines represent the general shapes of the exponential functions, \(e^{-x}\) and \(e^{x}\), which are related to the hyperbolic functions shown.