Long description: workbook6block4fig1
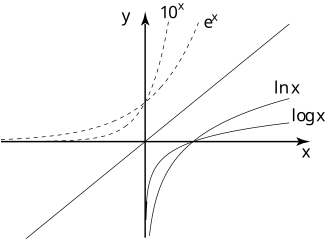
Alt text: A graph illustrating three exponential and logarithmic functions: \(y=10^x\), \(y=e^x\), and \(y=\text{ln }x\), plotted against the \(x\) and \(y\) axes.
This description was generated by AI and has not been verified by a human. If you spot an error, please use the feedback link below.
- The graph displays three curves representing different functions, including \(y=10^x\), \(y=e^x\), and \(y=\text{ln }x\), on a standard Cartesian coordinate system with the horizontal axis labeled \(x\) and the vertical axis labeled \(y\).
- The curve labeled \(y=10^x\) is an increasing exponential function that passes through the point \((0, 1)\) and rises sharply as \(x\) increases.
- The curve labeled \(y=e^x\) is another increasing exponential function, also passing through the point \((0, 1)\) but showing a different rate of increase compared to \(y=10^x\).
- The curve labeled \(y=\text{ln }x\) is a logarithmic function, which is defined only for positive values of \(x\) and increases slowly as \(x\) increases, exhibiting a vertical asymptote at \(x=0\).
- The graph also shows dashed lines representing the function values approaching the \(y\)-axis and the \(x\)-axis, consistent with the behavior of the plotted functions.