Long description: Block7_Fig6_2
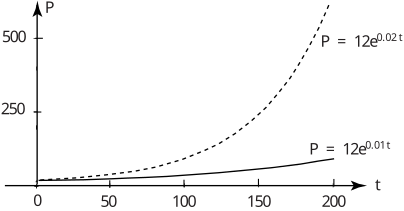
Alt text: A graph comparing two exponential functions, \(P = 12 e^{0.01t}\) and \(P = 12e^{0.02t}\), plotted against time.
This description was generated by AI and has not been verified by a human. If you spot an error, please use the feedback link below.
- The horizontal axis represents time, labeled \(t\), and ranges from zero to at least two hundred units.
- The vertical axis represents a quantity labeled \(P\), with markings at two hundred fifty and five hundred units.
- Two curves are plotted on the graph: one solid line and one dashed line.
- The solid curve represents the function \(P = 12 e^{0.01t}\), which shows a slow, gradual increase from the origin.
- The dashed curve represents the function \(P = 12e^{0.02t}\), which shows a much steeper, faster rate of increase compared to the solid curve.
- At time \(t=0\), both curves start at the same vertical position on the \(P\)-axis.
- As time \(t\) increases, the vertical distance between the dashed curve and the solid curve increases significantly, illustrating the difference in the growth rates of the two exponential functions.