Long description: trombone
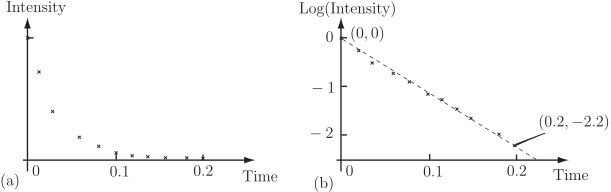
Alt text: The image displays two graphs: the left graph shows sound intensity decreasing over time, and the right graph shows the logarithm of intensity decreasing linearly over time.
This description was generated by AI and has not been verified by a human. If you spot an error, please use the feedback link below.
- The left panel, labeled (a), plots Intensity on the vertical axis against Time on the horizontal axis, showing a rapid decrease in intensity starting from a high value at time zero and approaching zero as time increases.
- The right panel, labeled (b), plots \(\text{Log}(\text{Intensity})\) on the vertical axis against Time on the horizontal axis. This panel displays a data set approximated by a straight line, which passes through the points \((0, 0)\) and \((0.2, -2.2)\).