Long description: Block7_Fig6_5
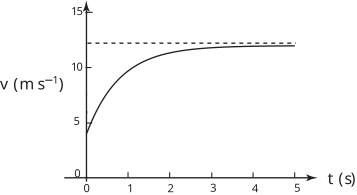
Alt text: A graph showing the speed of a parachutist increasing rapidly and then leveling off over five seconds.
This description was generated by AI and has not been verified by a human. If you spot an error, please use the feedback link below.
- The graph plots speed, denoted as \(v\), on the vertical axis in meters per second (\(\text{m} \text{ s}^{-1}\)), against time, denoted as \(t\), on the horizontal axis in seconds (\(\text{s}\)).
- The horizontal axis ranges from \(0 \text{ s}\) to \(5 \text{ s}\), and the vertical axis ranges from \(0 \text{ m} \text{ s}^{-1}\) to \(15 \text{ m} \text{ s}^{-1}\).
- The curve begins at the origin, indicating an initial speed of \(0 \text{ m} \text{ s}^{-1}\) at time \(t=0 \text{ s}\).
- Initially, the speed increases sharply as time progresses from \(0 \text{ s}\) to approximately \(2 \text{ s}\).
- The rate of increase in speed slows down significantly after about \(2 \text{ s}\), showing the speed approaching a maximum value.
- The graph flattens out, indicating that the speed is asymptotically approaching a constant value of approximately \(11.5 \text{ m} \text{ s}^{-1}\) by \(5 \text{ s}\).
- A dashed horizontal line is drawn across the graph at the speed value of \(11.5 \text{ m} \text{ s}^{-1}\), representing the limiting terminal velocity.