Long description: Block7_Fig6_6
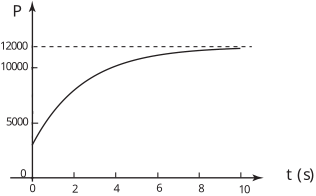
Alt text: A graph showing pressure, labeled as P, on the vertical axis, plotted against time, labeled as t, on the horizontal axis.
This description was generated by AI and has not been verified by a human. If you spot an error, please use the feedback link below.
- The graph displays a curve that represents a quantity P on the vertical axis (labeled P) as a function of time t on the horizontal axis (labeled t) in seconds.
- At time t equals zero seconds, the pressure P starts at a value of approximately 3000 on the vertical axis.
- The curve shows a rapid initial increase in P as time increases from zero to about two seconds.
- From approximately two seconds to four seconds, the curve continues to increase, but the rate of increase begins to slow down, indicating diminishing returns.
- Between four seconds and eight seconds, the curve continues to rise gradually, flattening out as it approaches a limiting value.
- At time t equals ten seconds, the curve levels off, approaching an asymptotic value for P that is slightly below 12000.