Long description: Block6_FigNEW1a
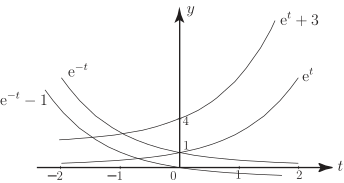
Alt text: A graph showing four different exponential functions plotted with the horizontal axis labeled as 't' and the vertical axis labeled as 'y'.
This description was generated by AI and has not been verified by a human. If you spot an error, please use the feedback link below.
- The graph displays four distinct curves representing different exponential functions, with the horizontal axis labeled "t" and the vertical axis labeled "y".
- The functions plotted are labeled as \(e^{-t}\), \(e^{t}\), \(e^{-t} - 1\), and \(e^{t} + 3\).
- The curve labeled \(e^{-t}\) starts high on the left side (at a negative value of "t") and decreases, approaching the horizontal line \(y=0\) as "t" increases.
- The curve labeled \(e^{t}\) starts low on the left side and increases exponentially as "t" increases.
- The curve labeled \(e^{-t} - 1\) is consistently below the x-axis, starting at a negative value on the left and increasing towards the x-axis as "t" increases.
- The curve labeled \(e^{t} + 3\) is the uppermost curve, always positioned above the horizontal line \(y=3\) for all visible values of "t".
- The y-axis has marked grid lines or labels at values like -4, and the x-axis has marked labels at -2, -1, 0, 1, and 2.