Long description: Block6_FigNEW1b
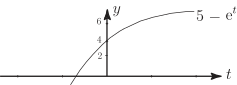
Alt text: The image is a graph showing a curve representing the function \(5 - e^t\) on a two-dimensional coordinate system with \(t\) on the horizontal axis and \(y\) on the vertical axis.
This description was generated by AI and has not been verified by a human. If you spot an error, please use the feedback link below.
- The graph displays a curve plotted on a Cartesian coordinate system, with the horizontal axis labeled \(t\) and the vertical axis labeled \(y\).
- The curve illustrates the function \(y = 5 - e^t\).
- At \(t = 0\), the curve passes through the point where \(y = 5 - e^0 = 5 - 1 = 4\), indicating an initial value of 4 on the vertical axis.
- As the value of \(t\) increases along the positive horizontal axis, the curve rises sharply initially and then gradually levels off, approaching a horizontal asymptote at \(y = 5\).
- The function approaches the value 5 as \(t\) tends towards positive infinity, as suggested by the curve's flattening behavior.