Long description: Block6_FigNEW3
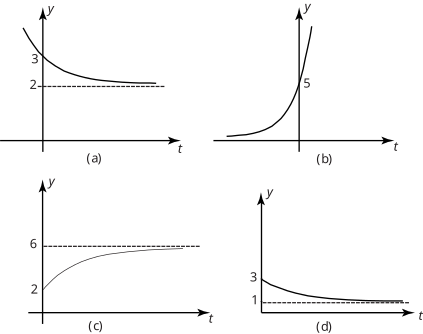
Alt text: The image displays four graphs, labeled (a), (b), (c), and (d), showing the relationship between a variable \(y\) on the vertical axis and time \(t\) on the horizontal axis.
This description was generated by AI and has not been verified by a human. If you spot an error, please use the feedback link below.
- The image contains four distinct graphs illustrating functions of time \(t\).
- Graph (a):
- Shows a curve starting at a high value on the vertical axis and decreasing as time \(t\) increases, approaching a dashed horizontal line at a value of 2. The curve appears to be decreasing towards the value of 2.
- Graph (b):
- Displays a curve that starts near the origin and increases rapidly as time \(t\) increases, rising steeply towards a value of 5 on the vertical axis.
- Graph (c):
- Presents a curve that starts at a low value on the vertical axis (near 1) and increases as time \(t\) increases, leveling off and approaching a dashed horizontal line at a value of 6.
- Graph (d):
- Shows a curve that starts at a value of 3 on the vertical axis and decreases as time \(t\) increases, approaching a dashed horizontal line at a value slightly above 1.